The research environment
The proprietary engine, knowledge base and shared engineering infrastructure.
The Mana research engine
Shared infrastructure. Market-specific models. A path from the research summary back to individual sessions.
The proprietary engine, knowledge base and shared engineering infrastructure.
The selected ES and GC intraday strategies documented in the research report.
The capitalisation and monthly sizing methodology applied to A103.
Multi-criteria selection
Mana compares strategies and combinations from several perspectives. The aim is to understand which trade-off fits the research objectives, rather than select on gain alone.
Start with the highest-gain combinations in the research universe, then examine their costs, net P&L and drawdowns.
Key questionWhat setbacks accompanied the gain?
Prioritise combinations with smaller observed drawdowns and more consistent annual results. Examine the weakest year alongside the overall gain.
Key questionHow deep were the declines, and how consistent were the years?
Use Gain/DD and Sharpe alongside annual consistency and net P&L to compare the trade-off between gain, setbacks and day-to-day variability.
Key questionWhat trade-off does the combination offer?
These are selection priorities. Capital and position sizing are assessed separately, using consistent comparison assumptions.
How the criteria are interpretedThe software, in practice
Explore combination analysis, daily detail, session replay and annual results. Select a capture to open it at full resolution.
Research examples. These historical views illustrate the software on the dates shown. Their figures are separate from the A103 R1 report.
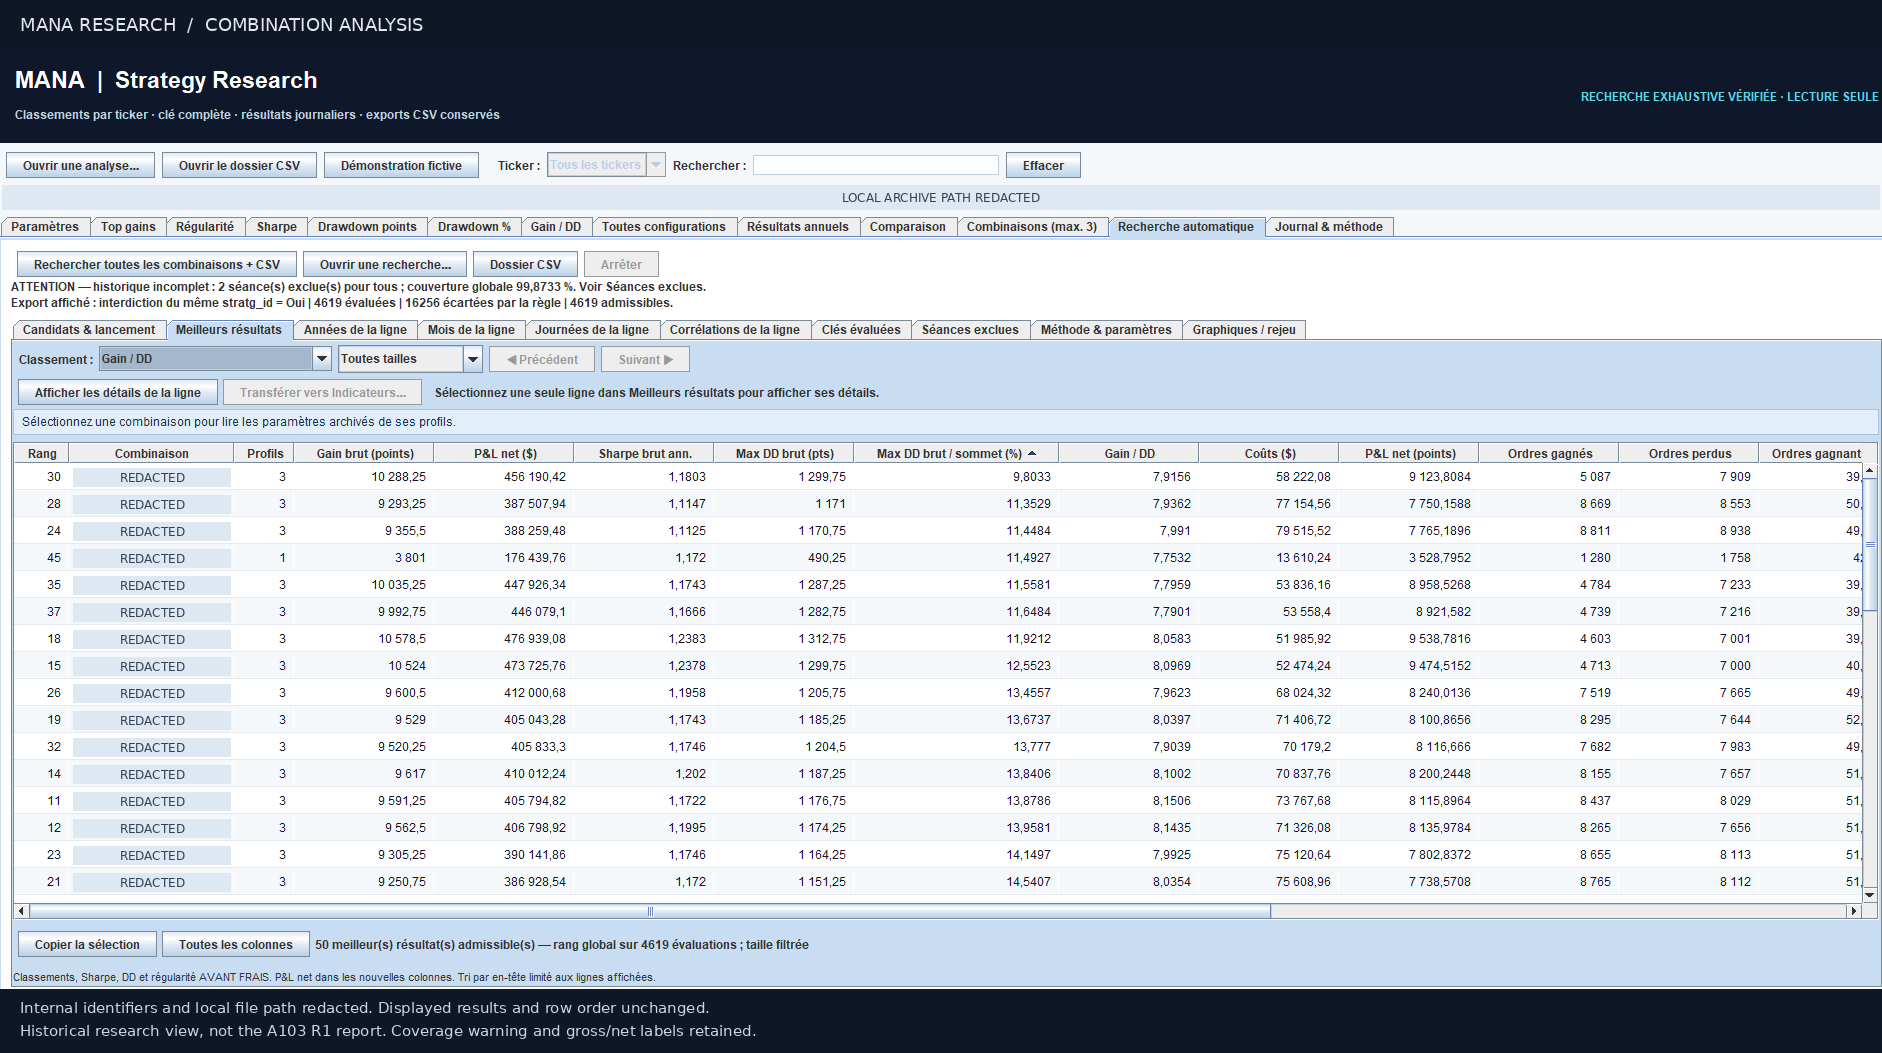
01 / COMBINATIONS
Compare gross results, costs, net P&L, Sharpe and drawdown in a single view.
 Open full-size image New tab
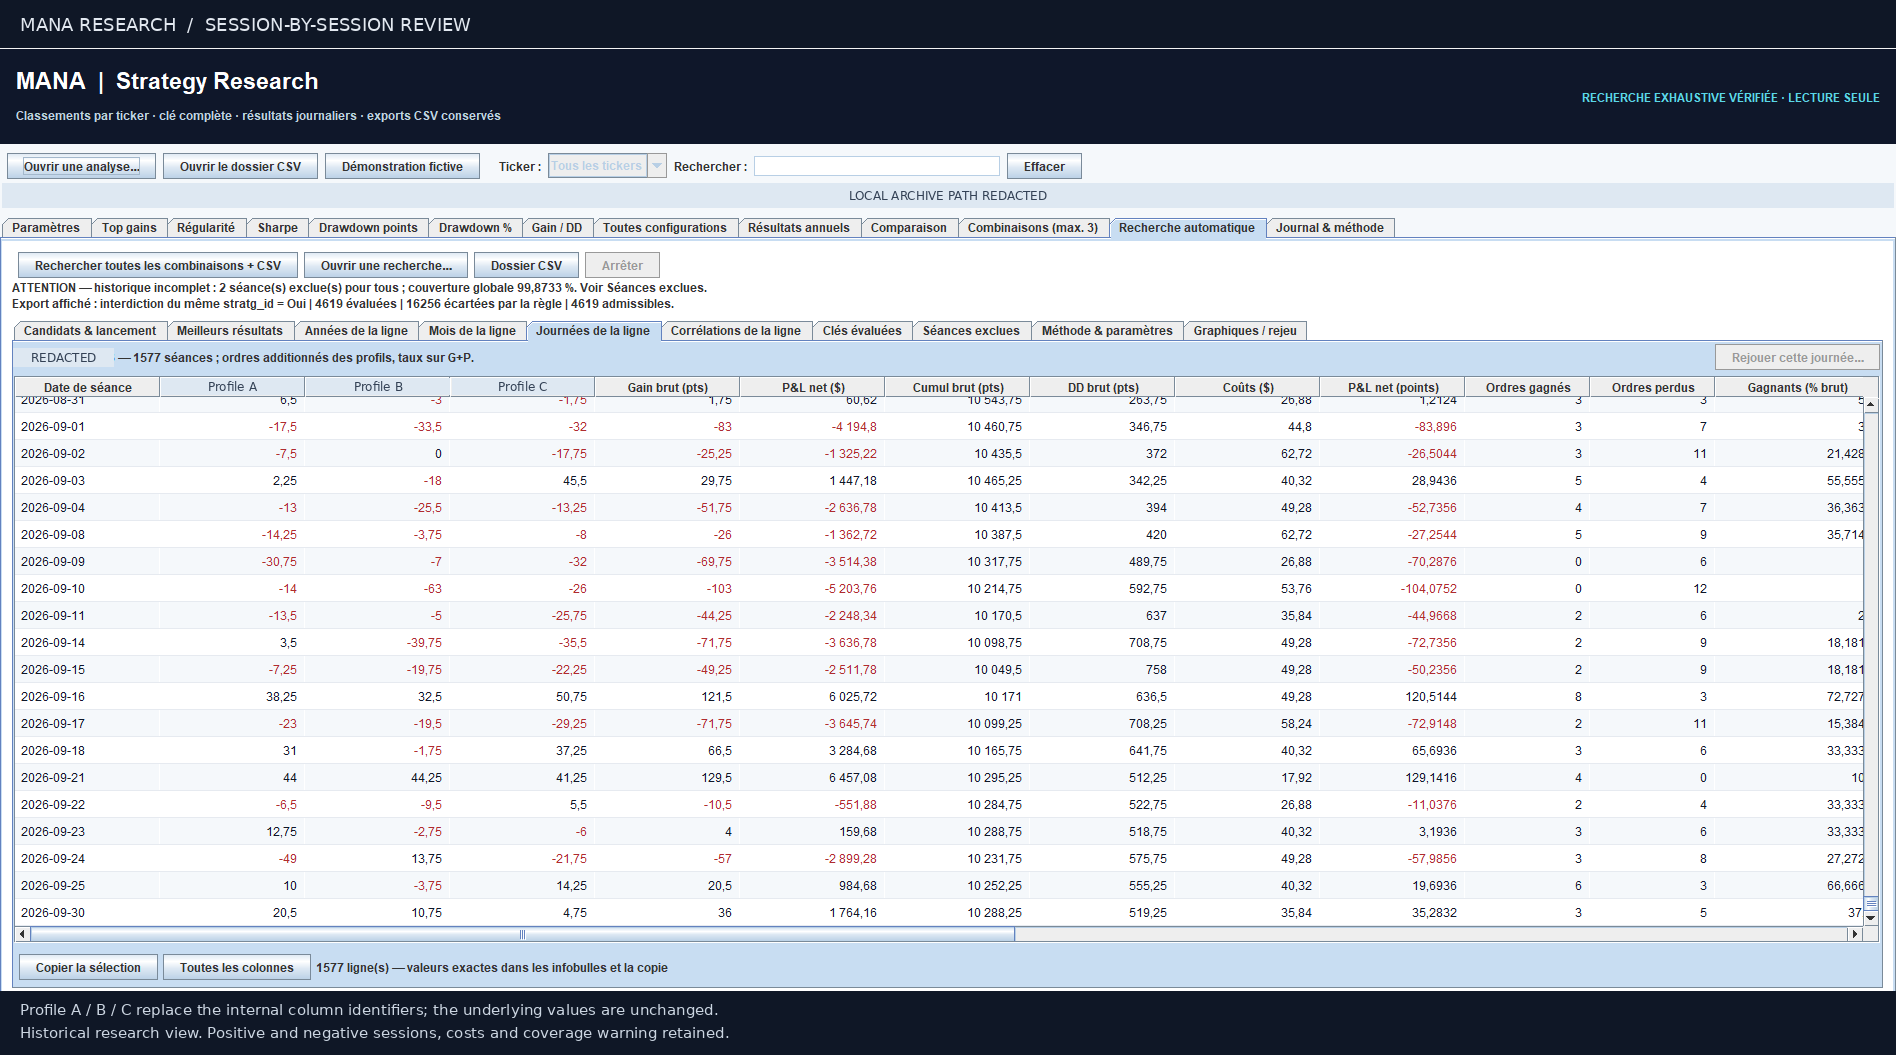
02 / SESSIONS
Follow each profile's contribution, the combined daily result and costs across winning and losing sessions.
 Open full-size image New tab
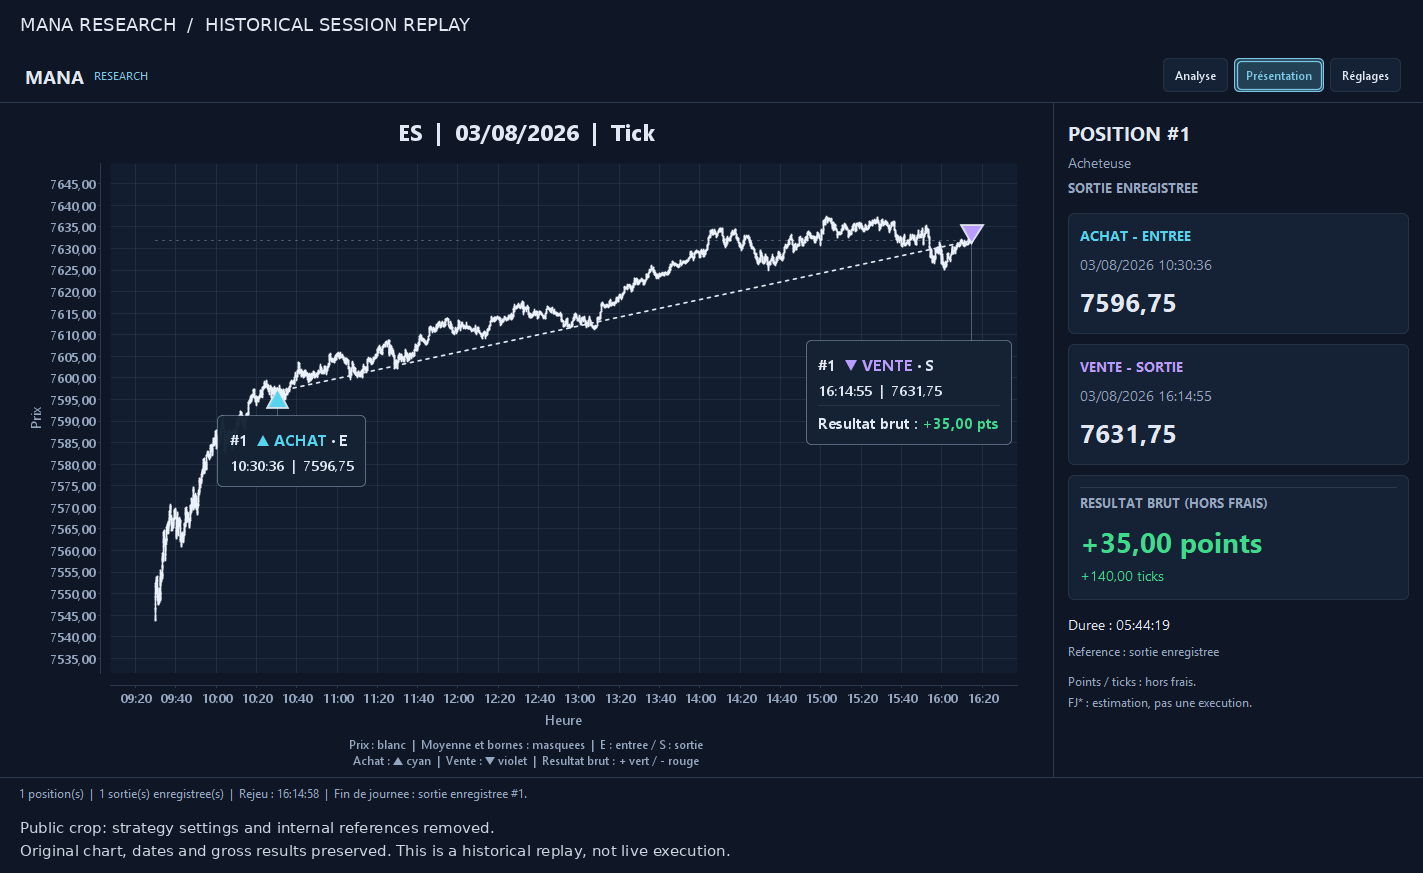
03 / REPLAY
Examine the price path, entry and exit markers, timestamps and gross result for a selected position.
 Open full-size image New tab
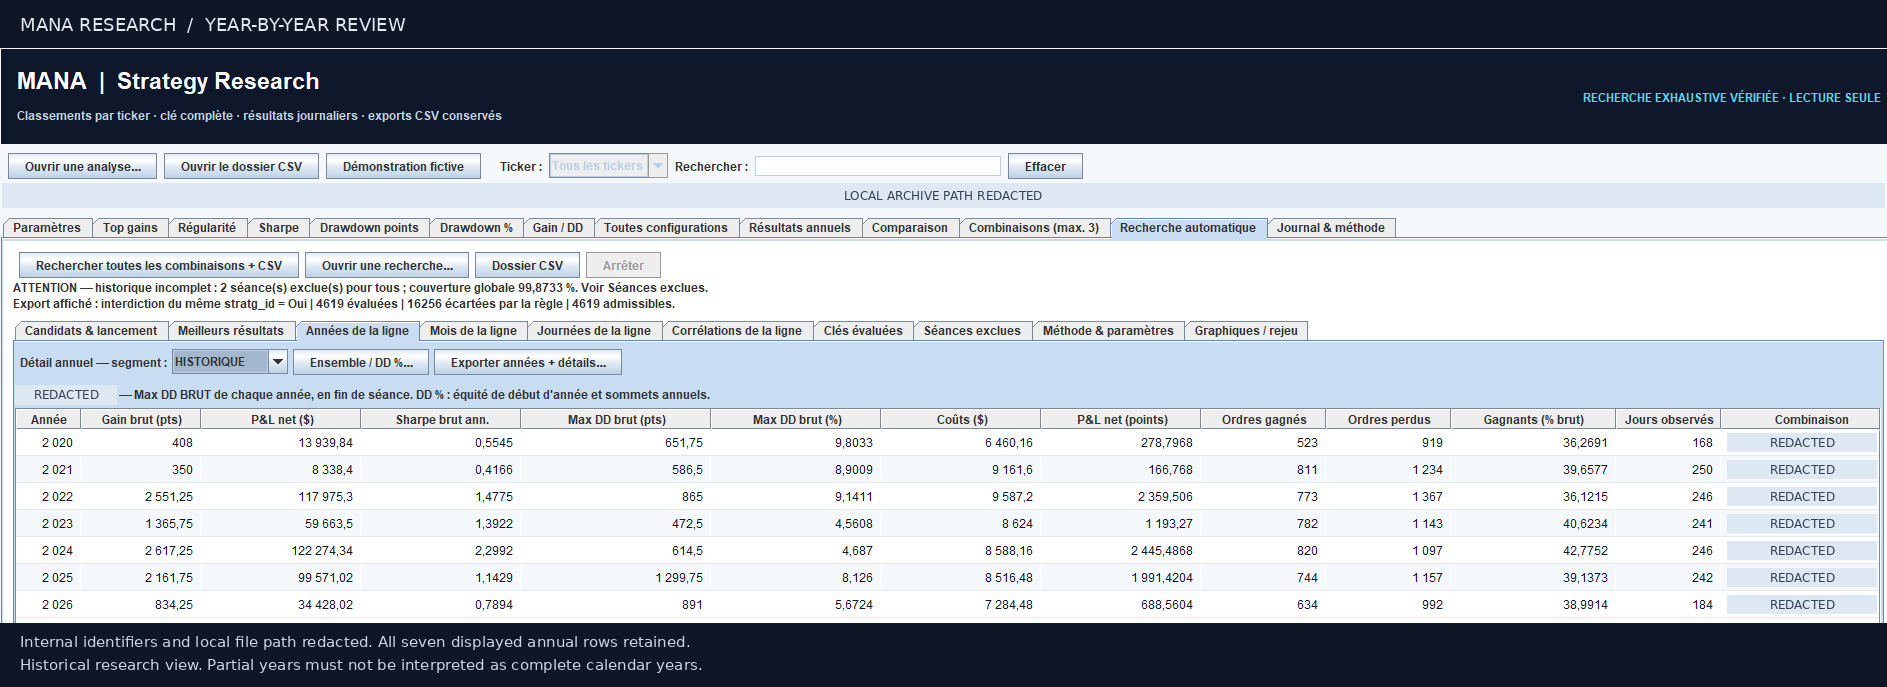
04 / ANNUAL
Review the combination year by year, with gross and net results, costs and drawdown side by side.
 Open full-size image New tab
Inside the process
Open each stage to explore its inputs and the questions considered during review.
Process overview. Four stages connect market observations to the examination of individual sessions.
Sessions, time zones and instrument-specific conventions frame the observations used in the research environment. Data integrity and the available observation window matter before a model is compared.
REVIEW INPUTS
OutcomeA documented research scope
Review focus: available sessions, data integrity and coverage.
Variables, interactions and parameter configurations are studied within a common engineering framework. Ongoing calibration of candidates is separate from changes to a selected reference strategy.
REVIEW INPUTS
OutcomeIdentifiable candidate configurations
Review focus: configuration identity, market-specific parameters and calibration choices.
Inspect daily and period results, indicative costs and drawdown. For a combination, examine its components as well as the total, under explicit capital and observation conventions.
REVIEW INPUTS
OutcomeA result with its calculation context
Review focus: gain, drawdown, costs and contributions across periods.
Replay a historical session or selected dates, examine entries and exits, and review the position details behind the daily result.
REVIEW INPUTS
OutcomeA detailed session-level review
Review focus: the price path, timestamps and position outcomes.
Session-level examination
Replay individual historical sessions or selected dates and examine the trading activity behind each result.
Signal logic, calibrated parameters and internal knowledge structures remain proprietary. Public captures show the analysis tools with confidential settings masked.
Research discipline
The research framework examines stability, traceability and risk across periods and operating assumptions.
Regime-based evaluation and chronological out-of-sample or walk-forward methodologies.
Parameter sensitivity, indicative transaction costs and adverse execution or liquidity conditions.
Data-integrity checks, monitoring and post-session review within explicit operating constraints.
The A103 report sets out the scope and calculation assumptions of its published results.
Ongoing research · Reference configurations
The A103 research documentation records strategy selection in late 2025 and the same trading configuration for the January 2026–October 2026 study period.
New observations and candidate-model calibration enrich the knowledge base. Research on candidates runs alongside the monitoring of identified reference configurations.
Research scope
Trading sessions, time zones and operating conventions are part of the common environment. Models are evaluated separately.
DOCUMENTED APPLICATION
The public A103 study covers these two components and their R1 portfolio calculation.
Review the documented study →BROADER RESEARCH UNIVERSE
Additional research programmes include EUR/USD and GBP/USD. Each instrument has its own evaluation; the published A103 report covers ES and GC.
Professional discussions
Discuss the engine, examine the methodology or explore a technology collaboration. Supplementary materials are shared case by case, subject to confidentiality.